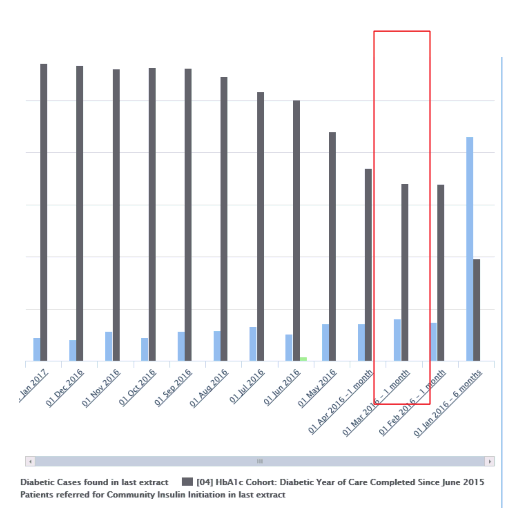
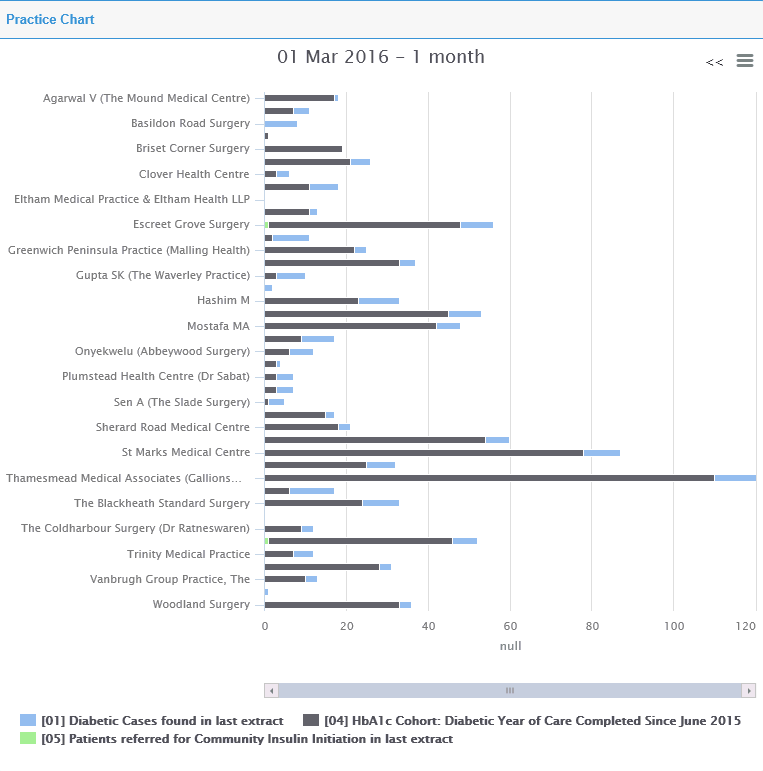
A Drill Down chart can display summaries of activity across practices and date ranges. When a user clicks on elements of the summary chart this will then drill down into the practice data making up that summary.
The summary and practice charts can be in different formats to represent the data as per user requirements.
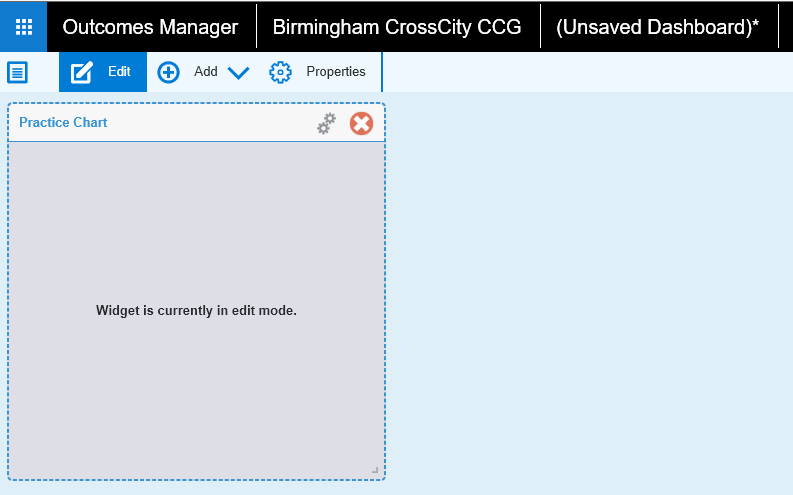
Creating a Drill Down chart
![]()

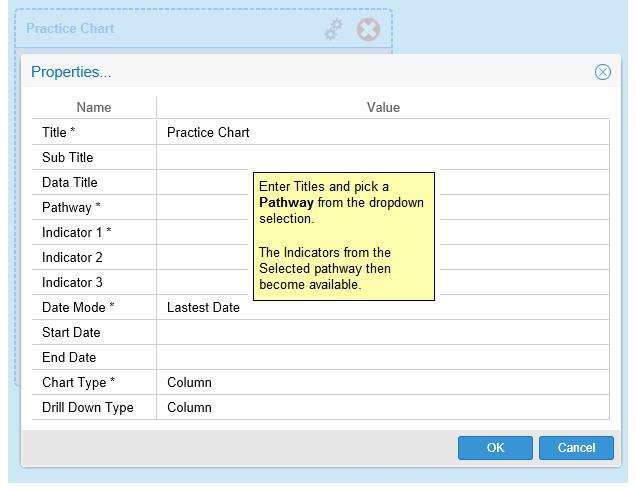
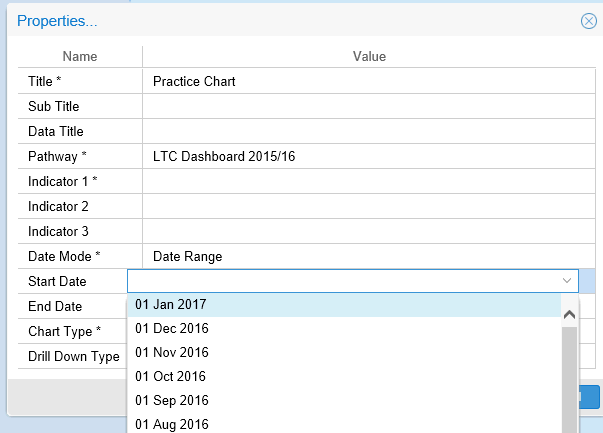
All Dates - will display all the available extracts for the pathway.
Date Range - Pick the Start and End Date from the available extracts.
(Note: Setting the Date Mode* to Latest Date does not activate the drill down feature)
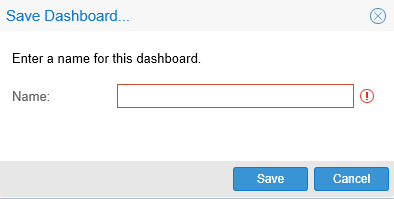
Your chosen summary chart will then display the total of the selected indicators by the dates you have specified.
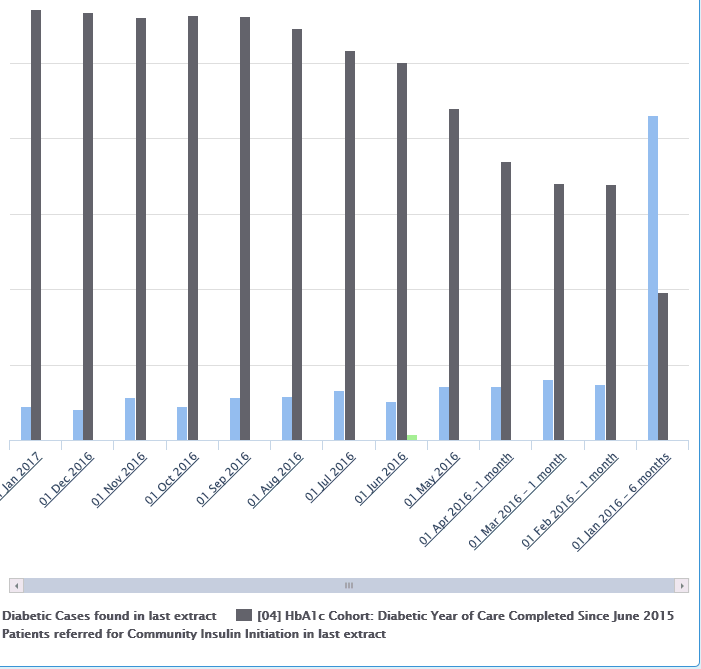
Clicking on a Summary indicator then activates the drill down into the chart.
