Practice Chart

The Practice Chart allows you to display Indicators in columnar form
for each practice. A maximum of 3 indicators can be displayed within the
widget.
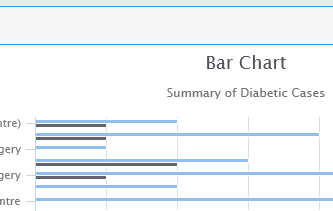
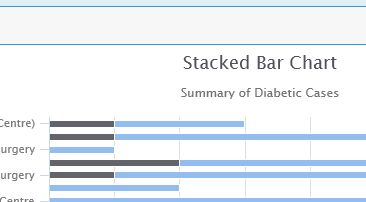
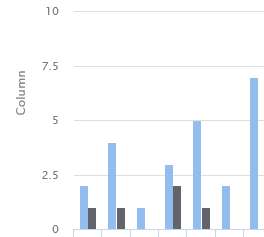
You can choose from 5 styles of column chart:
- Bar
- Column
- Stacked Bar
- Stacked Column
- Line
Chart.
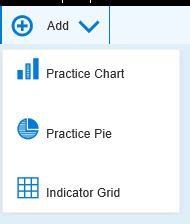
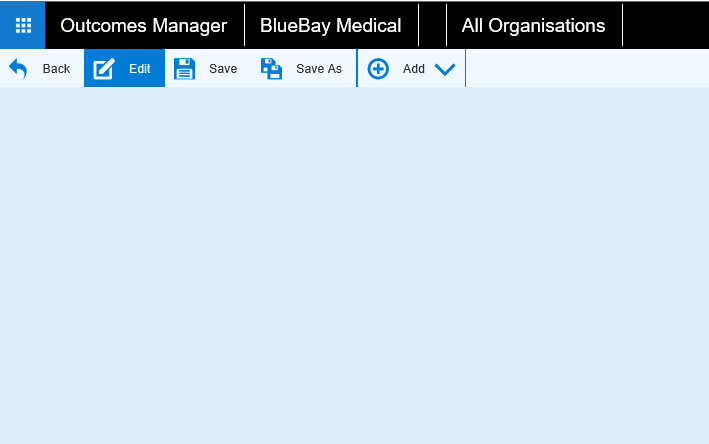
- In the Dashboard design screen (Unsaved Dashboard)* click the Add drop down icon and select
Practice Chart to add a blank
widget to your dashboard.
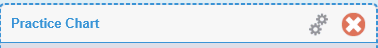
- Click on the 2 cogs to
open the properties screen to start configuring your widget.
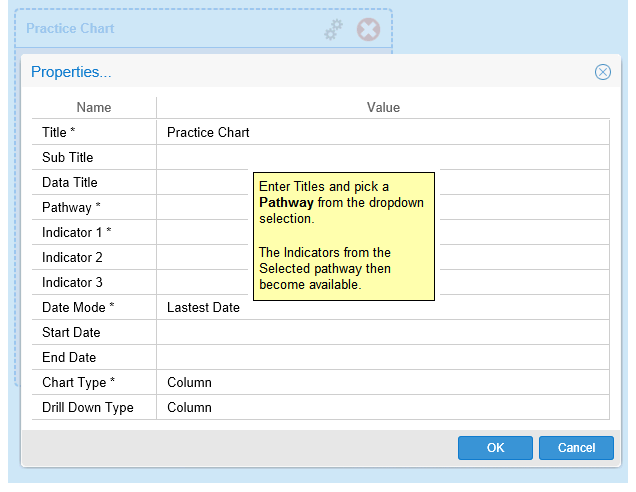
- Pick your indicators (up to 3).
Set to
Latest Date for the most recent report and to show the individual
practices.
- If you select the Date Range
or All Dates options, then
this creates a Drill
Down Chart.
- Reposition and resize your widget if required by dragging it around
in the dashboard.
- Once you have finished your chart you must click the Save
menu icon in
the Reporting Menu.
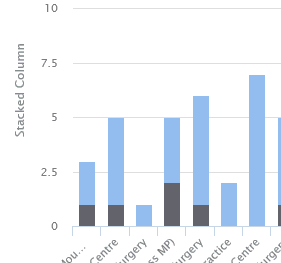
Chart Examples
- To delete your widget in Dashboard view, click on the red cross
in the widget properties box.
Practice
Pie Chart.
Indicator
Grid.
Line Chart.