Line Chart

The Line chart type is accessible
through the Practice
Chart menu.
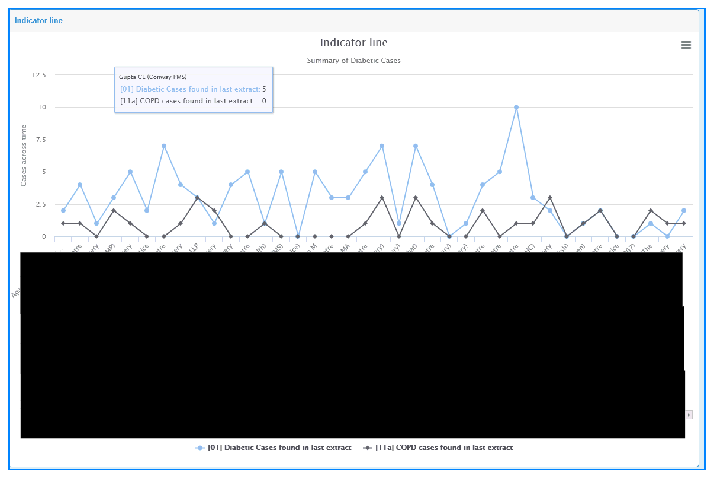
The Line chart allows you to trend multiple indicators over time in
order to view the uptrend or downtrend activity for the practices that
are reporting.
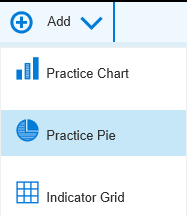
- In the Dashboard design screen (Unsaved Dashboard)* click the Add drop down icon and select
Practice Chart to add
a blank widget to your dashboard.
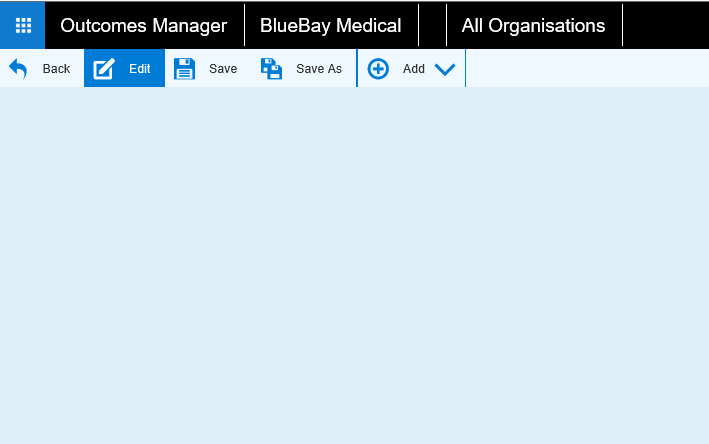
- Click on the 2 cogs to
open the properties screen to start configuring your widget.

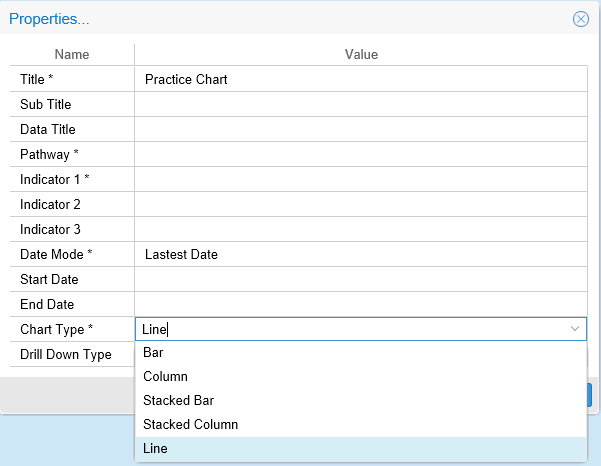
- Add a Title* and any Sub Titles\ Data
Titles as required.
- Pick your Indicators* (up
to 3).
Set to
Latest Date for the most recent report and to show the individual
practices.
If you select the Date Range
or All Dates options, then this
creates a Drill
Down Chart and will summarise the data.
- Set the Chart Type* as
Line.
- Reposition and resize your widget if required by dragging it around
in the dashboard.
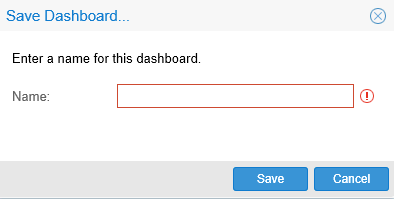
- Once you have finished your chart you must click the Save
menu icon
- To delete your widget in Dashboard view, click on the red cross
in the widget properties box.

Practice
Chart.
Practice
Pie Chart.
Indicator
Grid.
![]()


